Moore’s Law for Low Temperature Physics
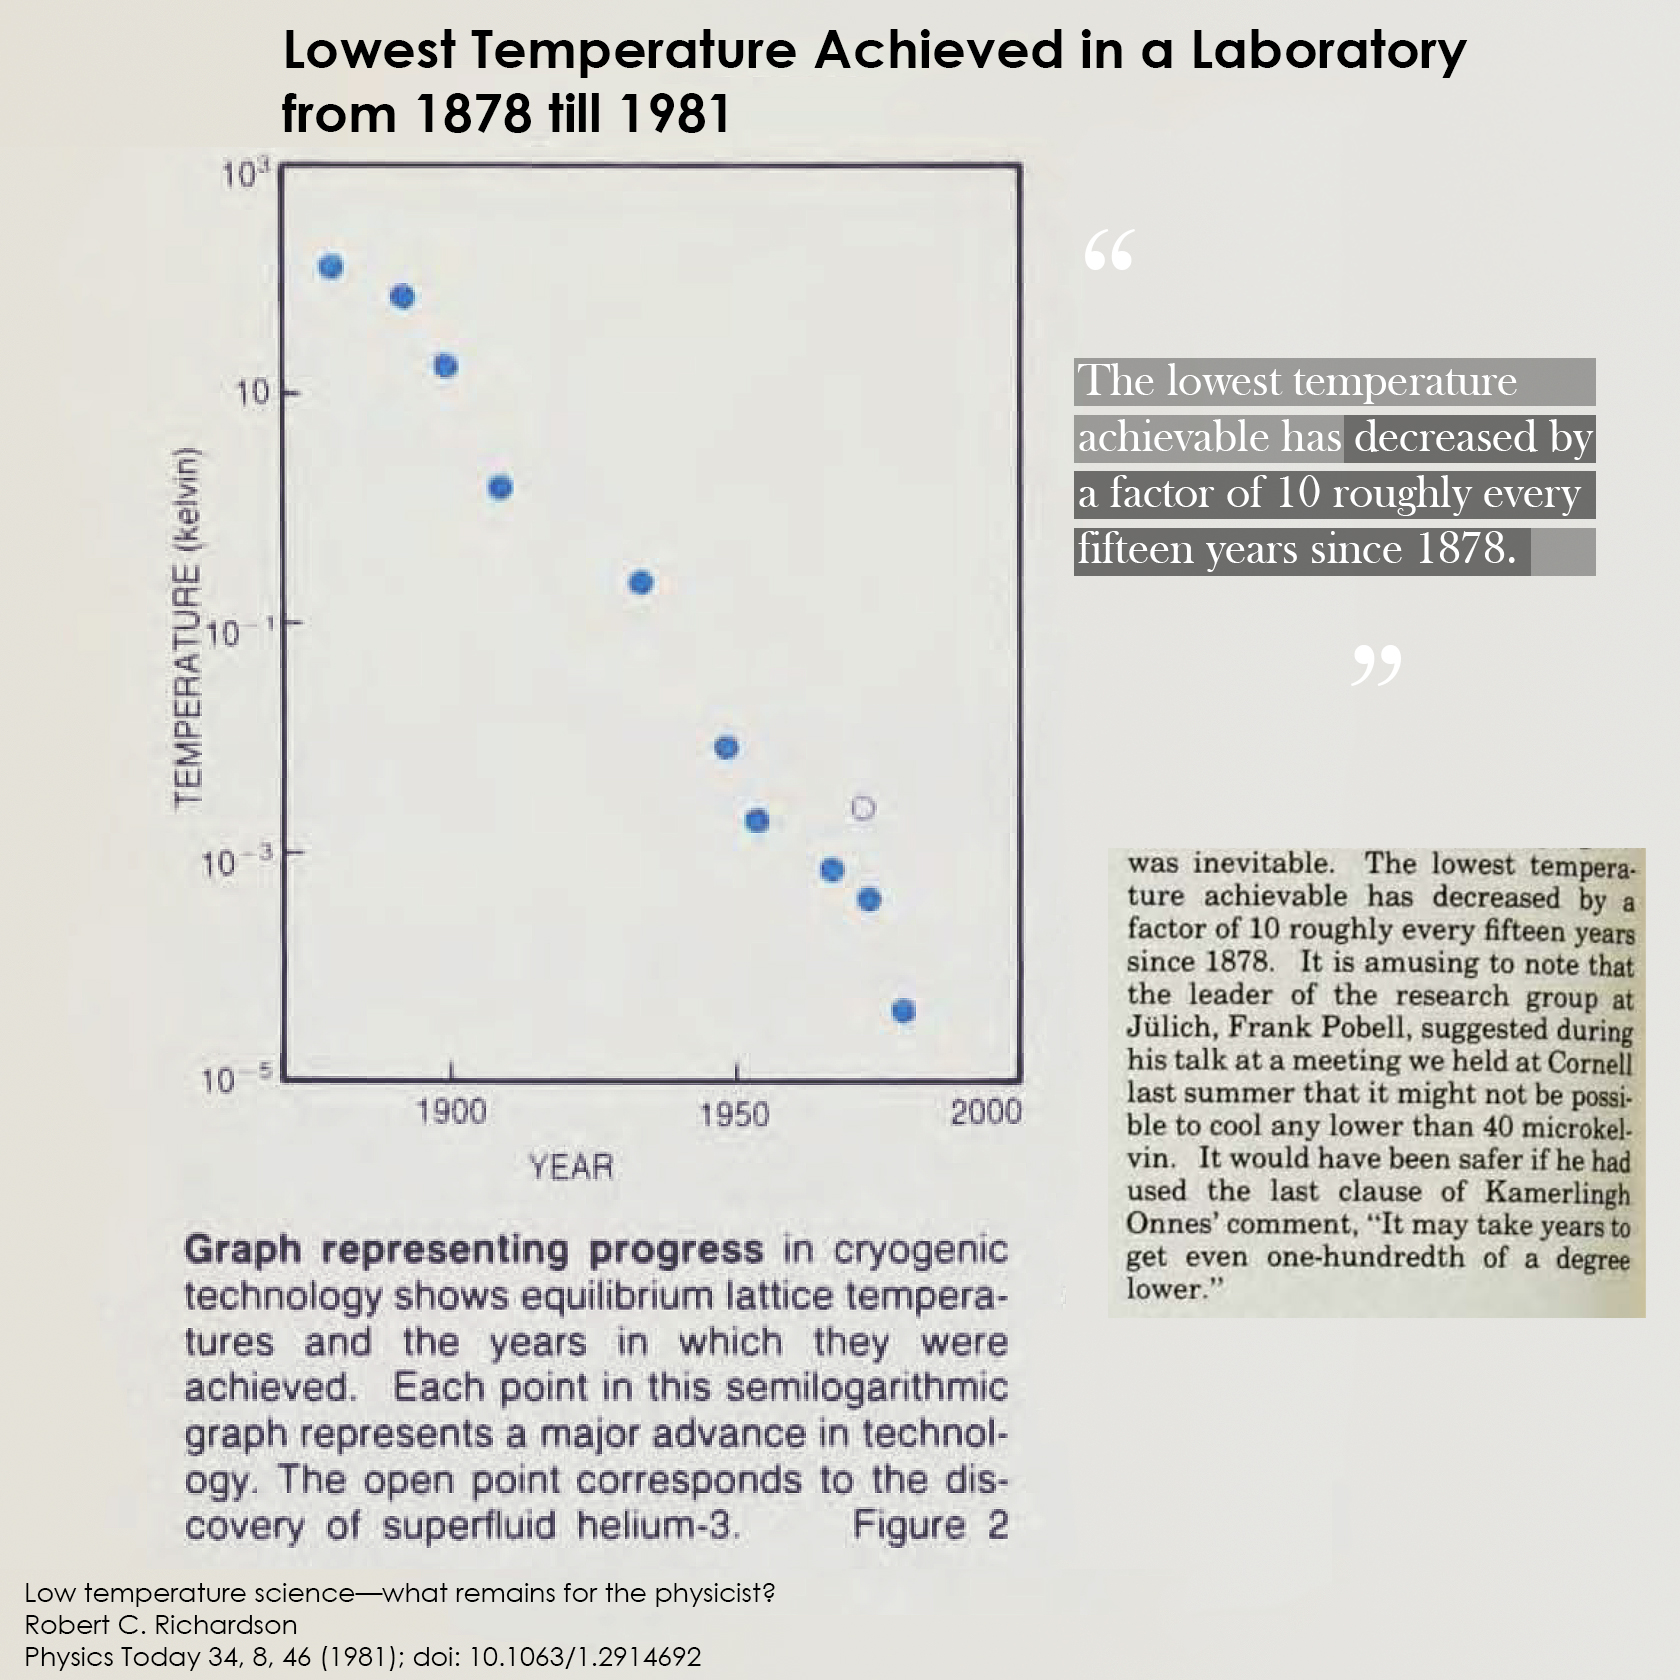
In a Physics Today article published in 1981, Bob Richardson (of Superfluid-Helium-3-discovery fame) provides both a retrospective of the field of low-temperature physics and a look ahead. Figure 2 of his article (shown here) plots the progress towards absolute zero over the years, but obviously stops at the time of his writing. Can we update this plot in the year 2021?
I wrote this in December 2021. The original text reflects that period; the chart and the November 2026 update include later results. I used OpenAI’s Codex to adapt my existing writing and research materials into this article and develop the interactive figures and layout.
About a month ago, I was searching for a hook to the talk I was supposed to give to the Alberta Section of the American Association Physics Teachers. The 10-minute talk had to be about my research, but unfortunately superfluid Helium-3 - and really condensed matter physics as a whole - requires a whole lot of motivation before we can get into the nitty gritty. In doing some general reading about superfluid Helium, I came across the above Physics Today article written by Bob Richardson.
Along with David Lee and Doug Osheroff, Bob Richardson discovered the superfluid nature of Helium-3 in 1972. This superfluid transition only happens below about 2.5 milliKelvins, which was just within reach of cryogenic technology back then. This was done using the combination of dilution refrigerator technology and the Pomeranchuk effect (see this book chapter). However, a different technique - nuclear demagnetization - had started surpassing the cooling rate achievable using these effects. To illustrate this, Figure 2 of his article shows the lowest-temperatures achieved over time, with the lone open circle in the plot being the discovery of superfluid Helium-3. This remarkable graph shows that progress in cryogenic technology has progressed at steady rate; The lowest temperature
achievable has decreased by a factor of 10 roughly every fifteen years since 1878.
The Mysteries of Figure 2
Though compelling, the text of the article was missing a lot of information about the individual data points. The first 5 points are related to the cooling down of common elemental gases; the 6th represents the demagnetization of Gd2(SO4)3·8H2O; the open circle represents the discovery of superfluid Helium-3. The rest is frustratingly hard to pin down - how does one define a significant advance in cryogenic technology? Google has not been very forthcoming on this matter.
The other immediate question is, has this trend continued till today? After combing the internet, I came to the conclusion that there was no updated plot showing how this trend has fared over the last 40 years. I guess if you want a job done, you gotta do it yourself. *rolls up sleeves*
Taking up the gauntlet
After using WebPlotDigitizer to scrape the pre-1981 information from the Figure, I was able to start piecing together the details. A couple of usual suspects were responsible for the early data points (Kamerlingh Onnes, James Dewar) but the first was from a group I had not heard of (Louis Paul Cailletet from France and Raoul Pictet from Switzerland, plus Zygmunt Wróblewski and Karol Olszewski from Poland who may have been shafted the honours). I was able to figure out a couple of the data points in the middle, but the rest were maddeningly difficult to identify.
From 1981 onwards, I had a heck of a time figuring out which claims should make it onto this illustrious (and incomplete) list. The results from the Bose-Einstein Condensate (BEC) community starting in 1995 were the most obvious inclusions. However the Low Temperature Laboratory at Aalto University has a couple of claims using Rhodium which seem to have achieved a lower temperature earlier? I unfortunately do not have the experimental training to discern if this record is slightly different as it seems to only to the temperature of the nuclear spins. Hopefully someone can help me out here, but notwithstanding, it seemed to me that the data points on this updated list could be broadly classified into 5 groups:
- Cooling of gases (either liquefaction or solidification),
- Magnetic demagnetization,
- Unknown,
- Superfluid Helium-3 (included here because I play favourites) and,
- BEC.
The updated "Moore's Law" for Low Temperatures
After many hours of learning how to use Plotly , I present to you, a first-crack at updating the graph for cryogenic records. If you can help fill in any of the 'unknown' information or you have a strong opinion on further experiments which should be included in this plot, PLEASE PLEASE let me know! I would be more than happy to keep updating this figure. But let's discuss the main takeaway below first.
Cooling milestones
Selected measurements on the way towards absolute zero.

The vertical axis is logarithmic. The original 2021 selection contains 17 points; two later reports are included in the updated view. New points use their publication year and show reported uncertainties.
These are different temperature measures: nuclear-spin temperatures and atomic-cloud expansion energies should not be read as the equilibrium temperature of an entire sample. Unidentified historical points remain marked as such.
View the measurements as a table
| Year | Temperature | Measurement | Source |
|---|---|---|---|
| 1877 | 123 K | Oxygen cooling | [1] |
| 1892 | 56 K | Air liquefaction | [2] |
| 1898 | 14 K | Hydrogen cooling | [3] |
| 1908 | 1.7 K | Helium liquefaction | [4] |
| 1926 | 700 mK | Gas-cooling milestone | Not identified |
| 1933 | 250 mK | Paramagnetic-salt demagnetization | [5] |
| 1948.59 (digitized) | 8.59 mK | Unidentified cooling milestone | Not identified |
| 1953 | 2 mK | Unidentified cooling milestone | [6] |
| 1966.93 (digitized) | 743 μK | Unidentified cooling milestone | Not identified |
| 1972 | 2 mK | Superfluid helium-3 | [7] |
| 1973.13 (digitized) | 403 μK | Unidentified cooling milestone | Not identified |
| 1979.25 (digitized) | 44.4 μK | Unidentified cooling milestone | Not identified |
| 1993 | 280 pK | Rhodium nuclear spins | [8] |
| 1995 | 20 nK | Bose–Einstein condensation | [9] |
| 2000 | 100 pK | Rhodium nuclear spins | [10] |
| 2003 | 450 pK | Sodium condensate | [14] |
| 2021 | 38 pK | Drop-tower matter-wave lensing | [11] |
| 2022 | 52 pK (+10 / −9 pK) | ISS Cold Atom Lab | [12] |
| 2026 | 9.7 pK (+3.2 / −2.7 pK) | Tiangong optical-dipole-trap condensate | [13] |
The trend continues!
Over the last 40 years, cryogenic advances have not continued falling by a factor of ten every 15 years - it has accelerated! In doing some research for this post, I came across the below prediction from a chapter in a review article from 1988: Assuming that the trend continues this suggests that 1 nK should be reached by about the year 2030.
Depending in which experiments you subscribe to, this milestone was passed only a few years after the publishing of this article, in the 1990s.

Microkelvin Physicsby G. R. Pickett, printed in 1988. The Figure 25 referenced in the text is very similar to the figure in Bob Richardson's article.
Which milestone is next?
Given the breakneck pace of cryogenic advances, and the history of under-predictions, it seems foolish to speculate what will come next. So I won't. ;) But it is a terrifyingly exciting time to be in condensed matter physics right now, and this is just one of the many reason it is so.
Added 18 November 2026
From the drop tower to orbit
The 2021 chart ended with the 38 pK expansion-energy scale reported by Deppner and collaborators. Two later space-based experiments give us useful points to add:
- 2022 · International Space Station: 52 pK. Gaaloul and collaborators used matter-wave lensing in NASA’s Cold Atom Lab to reduce the measured expansion-energy scale to about 52 pK, with an uncertainty of about 10 pK. This was a space-based control milestone rather than a lower value than the 2021 drop-tower result. [12]
- 2026 · Tiangong: 9.7 pK. Xiong and collaborators reported a rubidium condensate in an optical dipole trap with an equivalent temperature of 9.7 pK, with lower and upper uncertainties of 2.7 and 3.2 pK. They followed its free expansion for seven seconds. The paper was published online on 5 November 2026. [13]
In these experiments, the quoted picokelvin scale describes how slowly an atomic cloud expands. It does not mean the apparatus, the space station, or every degree of freedom is at that temperature. The rhodium points refer to nuclear spins, so the chart brings together several kinds of progress rather than a single uniform record.
Chart references
Each entry identifies the milestone first, then the source. Unresolved historical entries retain the uncertainties in the original notes.
- Oxygen liquefaction (1877)
- Air liquefaction (1892)
- Hydrogen cooling (1898)
“Cryogenics — History,” Science Encyclopedia. Historical overview linked in the original article.
The original notes describe this point as hydrogen freezing. Its date and temperature are retained pending a closer historical check.
- Helium liquefaction (1908)
- Adiabatic demagnetization of a paramagnetic salt (1933)
- Unidentified cooling milestone (1953)
Europhysics News, December 1982, p. 7. Historical source linked in the original article.
The experimental process behind this point remains unidentified.
- Discovery of superfluid helium-3 (1972)
D. M. Lee, “The extraordinary phases of liquid ³He,” Reviews of Modern Physics 69, 645 (1997).
- Rhodium nuclear-spin cooling (1993)
- Bose–Einstein condensation in dilute gases (1995)
Royal Swedish Academy of Sciences, “The Nobel Prize in Physics 2001,” press release (2001).
A background source for the 1995 condensation milestone; the 20 nK point is retained from the original chart.
- Rhodium nuclear-spin cooling (2000)
The 100 pK point is retained from the original chart. The detailed report distinguishes temperatures achieved below 100 pK from a lowest directly measured value of 280 pK.
- Matter-wave lensing in a drop tower (2021)
- Atomic-cloud collimation on the ISS (2022)
The quoted 52 pK is an expansion-energy scale inferred from the measured cloud expansion, with a reported uncertainty of about 10 pK.
- Optically trapped quantum gas aboard Tiangong (2026)
Equivalent temperature 9.7 pK, with lower and upper uncertainties of 2.7 and 3.2 pK; the cloud was observed in free expansion for 7 seconds.
- A sodium condensate below 500 pK (2003)
This supplies the missing reference for the original 450 pK point.